Exploratory Analytics
Air Crash Analytics Dashboard
A compact dataset + visual story: annual crash counts, fatality trends, monthly seasonality, and a searchable table. Built with Pandas, exported to charts, and presented on the web.
Browse DatasetKey Charts
Static images generated from the analysis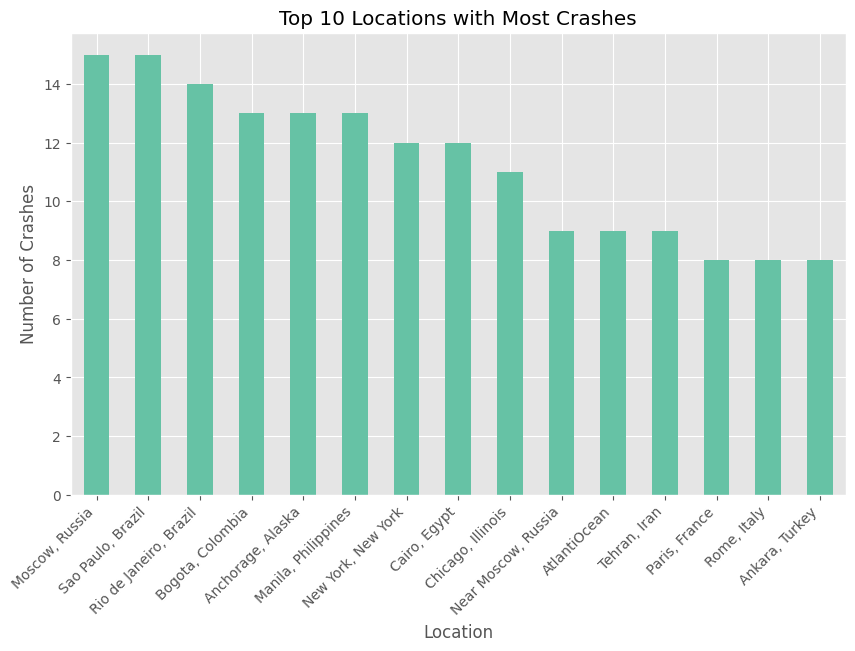
Top 15 Locations with Most Crashes
Geographic concentration of incidents.
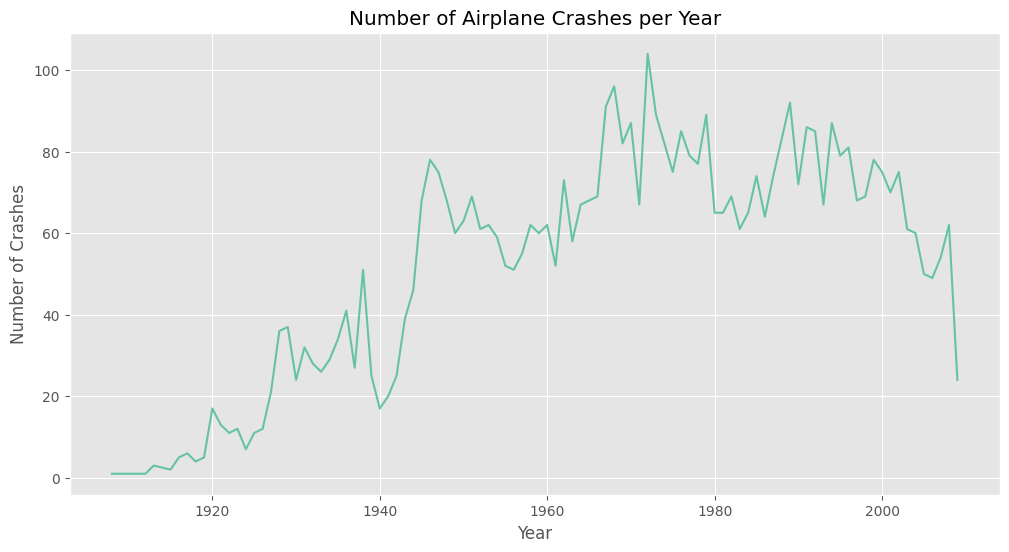
Crashes per Year
Long-term count trend by calendar year.
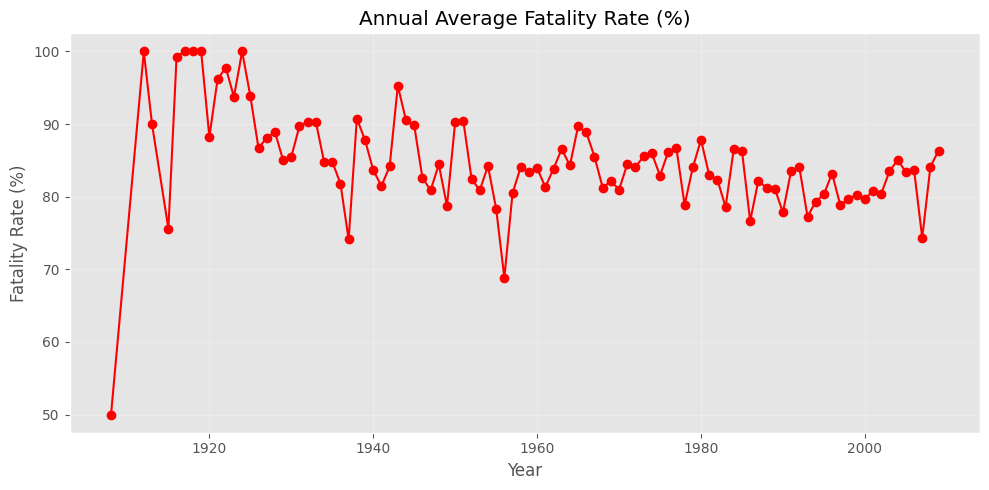
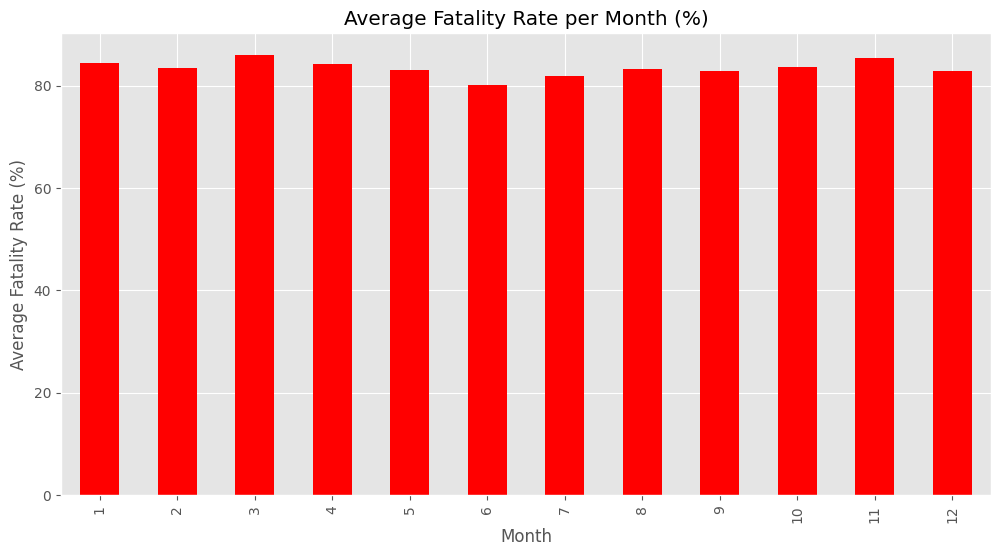
Yearly Average Fatality Rate
Average % of fatalities among involved passengers per year.
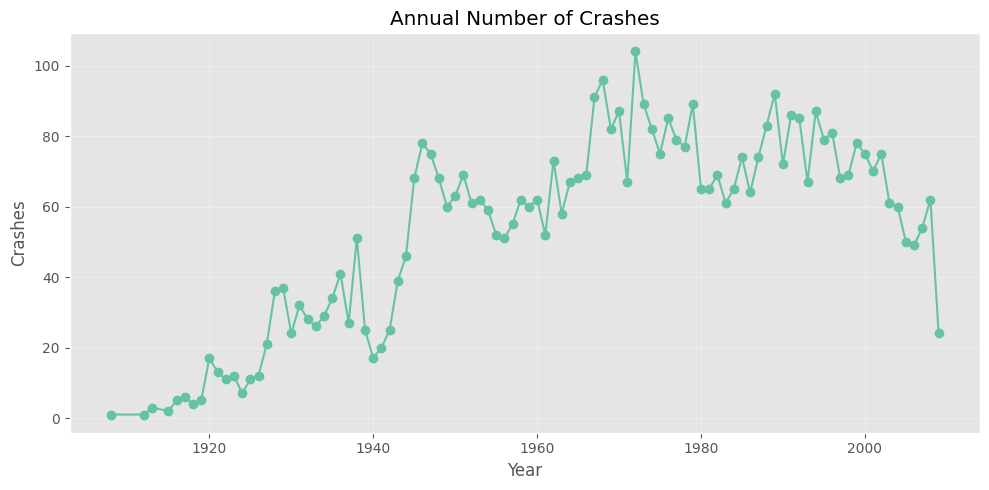
Yearly Crash Count
Alternate visualization of annual totals.
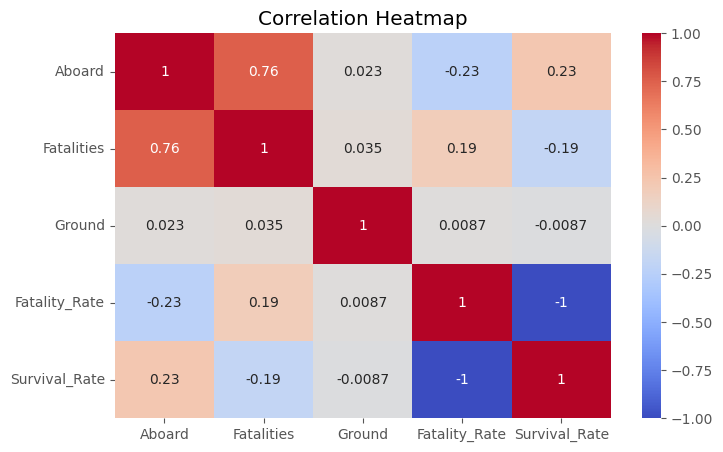
Correlation Heatmap
Relationships among numeric features.
Average Fatality Rate per Year
Smoothed perspective on annual fatality %.
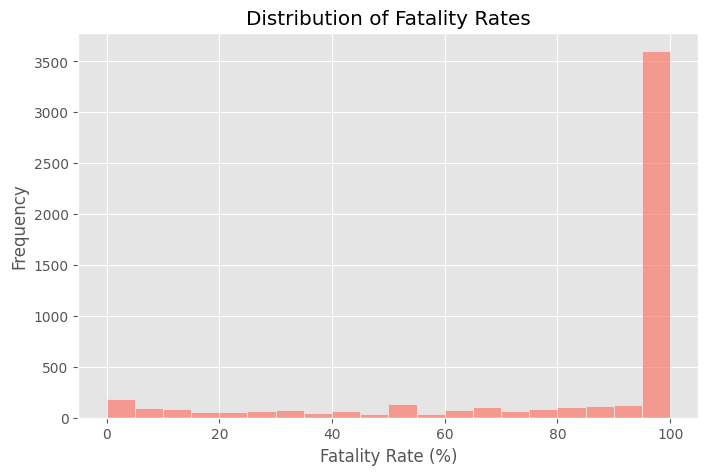
Distribution of Fatality Rates
How fatality % varies across incidents.
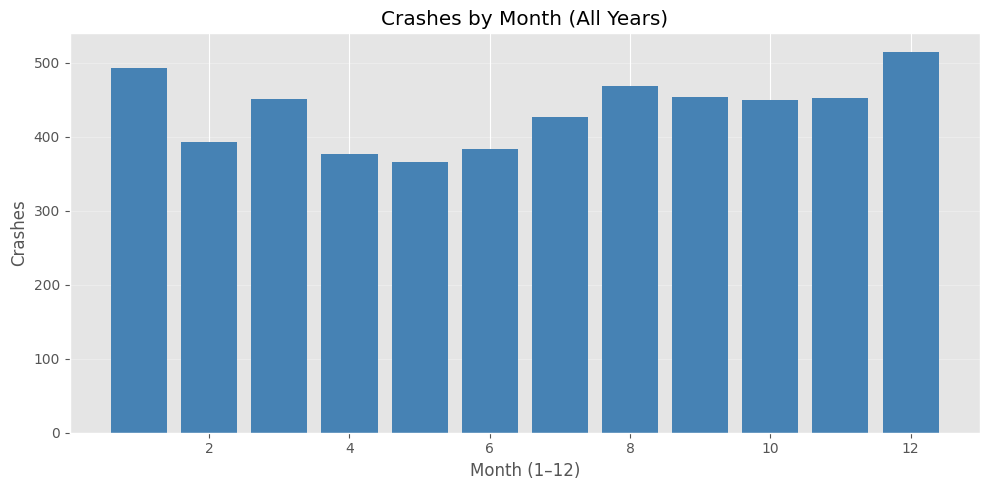
Monthly Crashes
Seasonality across months aggregated over years.
Aviation Visuals
Royalty-free imagery from Unsplash
Cockpit instrumentation & flight deck.

Runway operations and approach.

Aircraft silhouette at sunset.
Dataset Preview
Loaded directly from CSVSource: df_flight.csv
Search, sort, paginate, and export.